



[ad_1]
A powerful new on-chain analysis tool called the Bitcoin Cycle Extremes indicator has been released. It’s designed to help find extreme conditions in the Bitcoin market. It attempts to answer the ultimate question of when the crypto market is at a peak or a bottom.
Of course, there are many great tools and indicators that can be looked at individually or in combination. They provide guidance in looking for confluence on your own in determining extreme market conditions. However, there is a way to automate this confluence of more indicators and put them into one common metric. Taking into account the many components and factors of the Bitcoin market aims to identify potential peaks and lows more accurately.
Cycle Extremes, a new tool from Glassnode, aims precisely to create such an indicator that does not rely on a single on-chain data set but combines several fundamental metrics into one synergetic whole. Thus, if an extreme conditions signal appeared on this combined metric, its strength would be much greater than those of the separate components.
A basic version of the Cycle Extremes indicator was recently presented by Glassnode lead analyst @_Checkmatey_ on his Twitter feed. On that occasion, he stated that “confluence is your friend.”
In addition to the basic version, there is also a second version with oscillators, which we will present below.
Cycle Extremes: 4 indicators in 1
On-chain analysis is an attempt to quantify the behavior of Bitcoin investors. This can be done in terms of various criteria, categories, and metrics, such as on-chain activity, profit and loss, or coin holding period.
The Cycle Extremes indicator from Glassnode takes into account the four most popular metrics that have historically shown high accuracy in determining the peaks or lows of BTC cycles. Specifically, it measures +/- 1 standard deviation from the extremes of the following oscillators:
MVRV Ratio (green) – indicates the unrealized profit/loss for the entire market
aSOPR (yellow) – measures the extreme levels of realized profit/loss
Puell Multiple (blue) – indicates the relative revenue and profitability of BTC miners
Reserve Risk (red) – shows the degree of coins HODLing
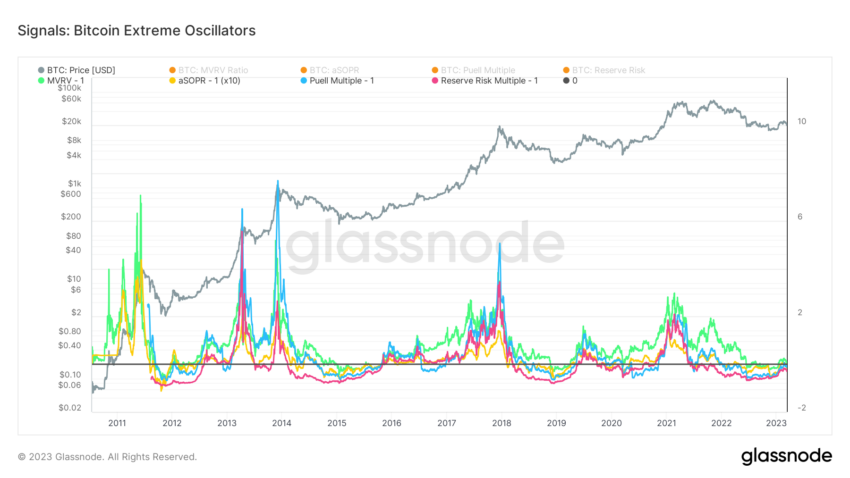
Bitcoin Peaks and Lows Signals
Each of the above metrics returns a binary value of 1 or -1 if it reaches an extreme high or low. Meanwhile, the Cycle Extremes indicator aggregates these values for all four metrics. The indicator identifies a Bitcoin market peak or bottom if a confluence of at least 3 of its 4 components appears.
In such a situation, Cycle Extremes generates a blue signal for an extremely cooled market at the end of a bearish trend. In contrast, a yellow signal for an extremely overheated market usually appears at the end of a bullish trend.
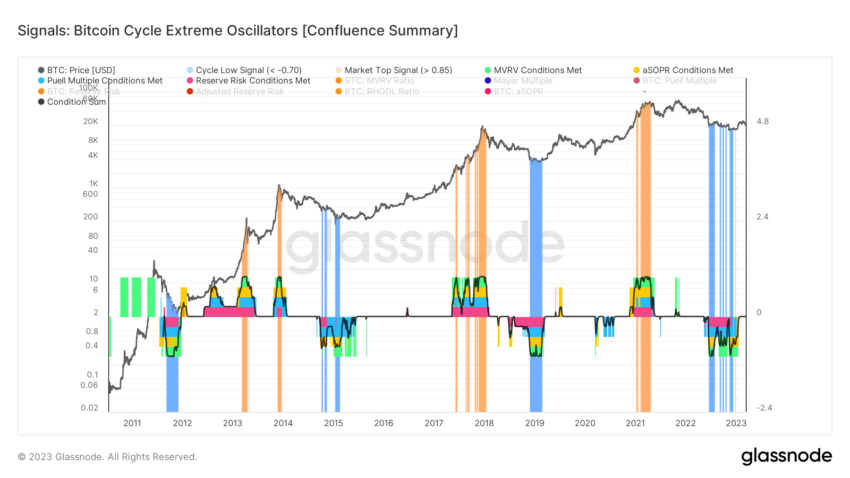
The chart shows that the extremes of the ongoing bear market appeared between mid-June and the end of December 2022. With the rebound in the Bitcoin market and the rise to the peak at $25,000 since the beginning of 2023, the blue signals of extreme downward deviation have disappeared.
It is worth mentioning that the ongoing decline below $20,000 has not generated another signal on the indicator.
Is the Worst of the Bear Market Over?
However, the most important question remains: what is the chance that bearish signals can still return in the current cycle? In the chart above, we can see that no historical bear market has been followed by blue signals for such a long period of time, about 6 months.
On the other hand, in previous macro bottoms, the blue signals from Extreme Cycles were not so diffuse and spotty. Only the 2014-2015 bottoms somewhat resemble the current cycle bottom structure. However, the current dispersion of signals is still at a record high.
Regardless of the future fate of Bitcoin, it’s worth watching this new development of on-chain analysis from time to time. The growing complexity of the cryptocurrency sector requires a global view and analytical innovation. At the same time, one should not succumb to the illusion of a single, magical indicator that is never wrong.
For BeInCrypto’s latest Bitcoin (BTC) analysis, click here.
Disclaimer
BeInCrypto strives to provide accurate and up-to-date information, but it will not be responsible for any missing facts or inaccurate information. You comply and understand that you should use any of this information at your own risk. Cryptocurrencies are highly volatile financial assets, so research and make your own financial decisions.
[ad_2]
Source link



