


[ad_1]
NUPL is one of the best-known indicators of on-chain analysis. Currently, its readings are in the yellow range of optimism, which has historically suggested that Bitcoin accumulation is underway. Will history rhyme this time too?
How long will Bitcoin (BTC) accumulate last before investors realize large profits comparable to previous cryptocurrency market bull markets? This question, which in itself expresses hope for a positive future for the crypto sector, can be answered with the NUPL indicator.
NUPL: Bitcoin Accumulation Continues
Net Unrealized Profit/Loss (NUPL) expresses the difference between relative unrealized profit and relative unrealized loss. Another way to calculate this ratio is to subtract the realized market capitalization from the total market capitalization and then divide the result by the latter number.
The charm of this indicator is that on the chart from Glassnode, its raw data are colored in 5 different colors. These correspond to the different emotional states (from fear to greed) that most investors are experiencing at different stages of the Bitcoin cycle.
The colored areas make it easier to identify the recurring phases of the cycle visually and can also suggest the future direction of the market.
Currently, the NUPL for Bitcoin is in the yellow range between 0.25-0.50, which suggests investor optimism. Interestingly, historically, this area has always coincided with the period of Bitcoin accumulation characteristic of an early bull market (blue boxes).
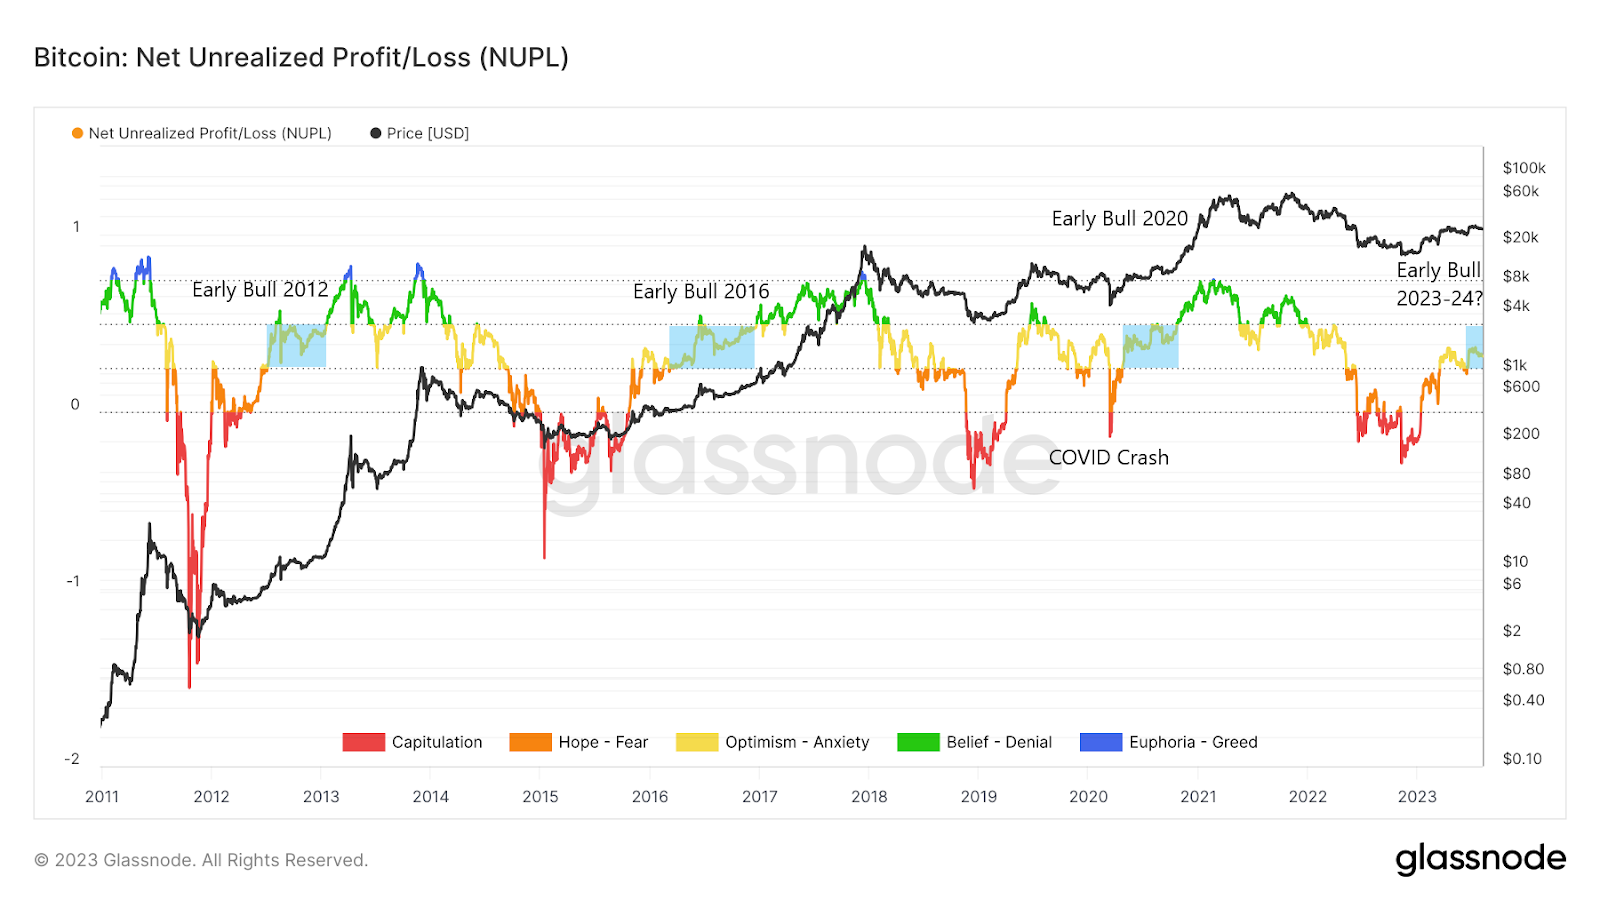
However, it is worth adding that this was only the case when NUPL had already bounced out of the red capitulation area. This happened only after the BTC price reached a macro bottom.
Moreover, in 2020, NUPL recorded the red area for the second consecutive time due to the COVID-19 crash.
In contrast, when NUPL reached the yellow area as a result of the downtrend from the historical highs, then its correct psychological interpretation was anxiety.
NUPL and 3 Assumptions on the Way to Bitcoin ATH
So, if we make a few assumptions based on the above chart, we can try to use NUPL to predict the future development of the Bitcoin market. Interestingly, we can both try to predict how much longer the early bull market phase will last and estimate when Bitcoin will reach the peak of the current cycle.
First, we assume that the Bitcoin market has left the area of fear for good, defined by the NUPL range between 0-0.25. However, if deep declines occur in the market, the NUPL could return to the orange or even red area, as in 2020.
Then the Bitcoin accumulation hypothesis would be falsified, and the cryptocurrency market would experience something like a double-bottom pattern.
Second, we assume that the current Bitcoin accumulation will be similar to previous ones and will last about 7 months (32 weeks). We arrive at this figure by taking the arithmetic average of all the previous three accumulation periods in the yellow NUPL area (30, 41, and 25 weeks, respectively – blue ranges).
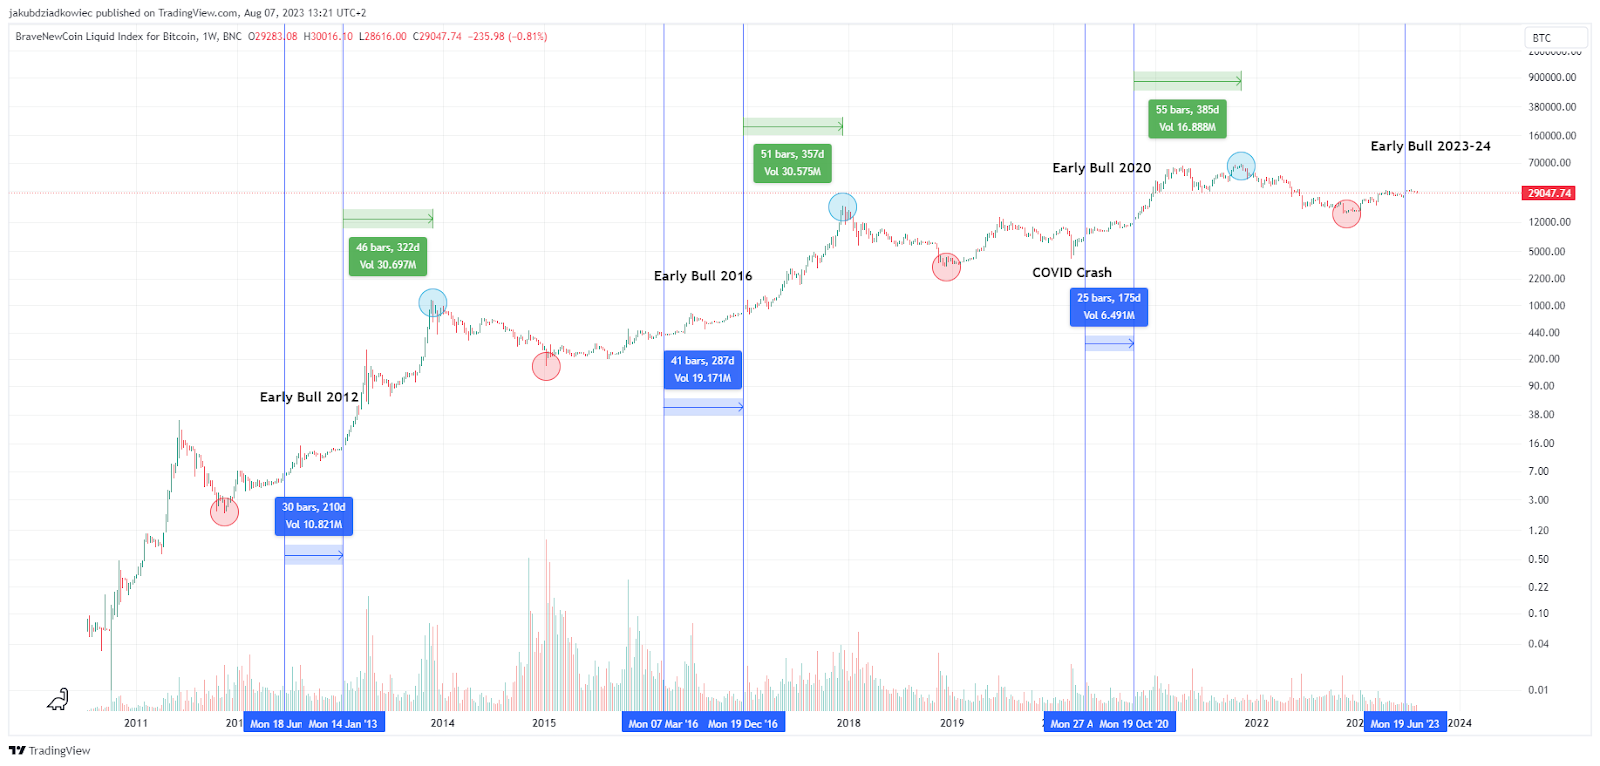
Third, we assume that Bitcoin reaches the cycle’s peak about 12 months (51 weeks) after entering the late phase of the bull market. This agrees with the arithmetic average of previous cycles. BTC reached all-time highs in 46, 51, and 55 weeks after NUPL entered the green area of belief (green ranges).
Bitcoin Accumulation Will Last Another 6 Months
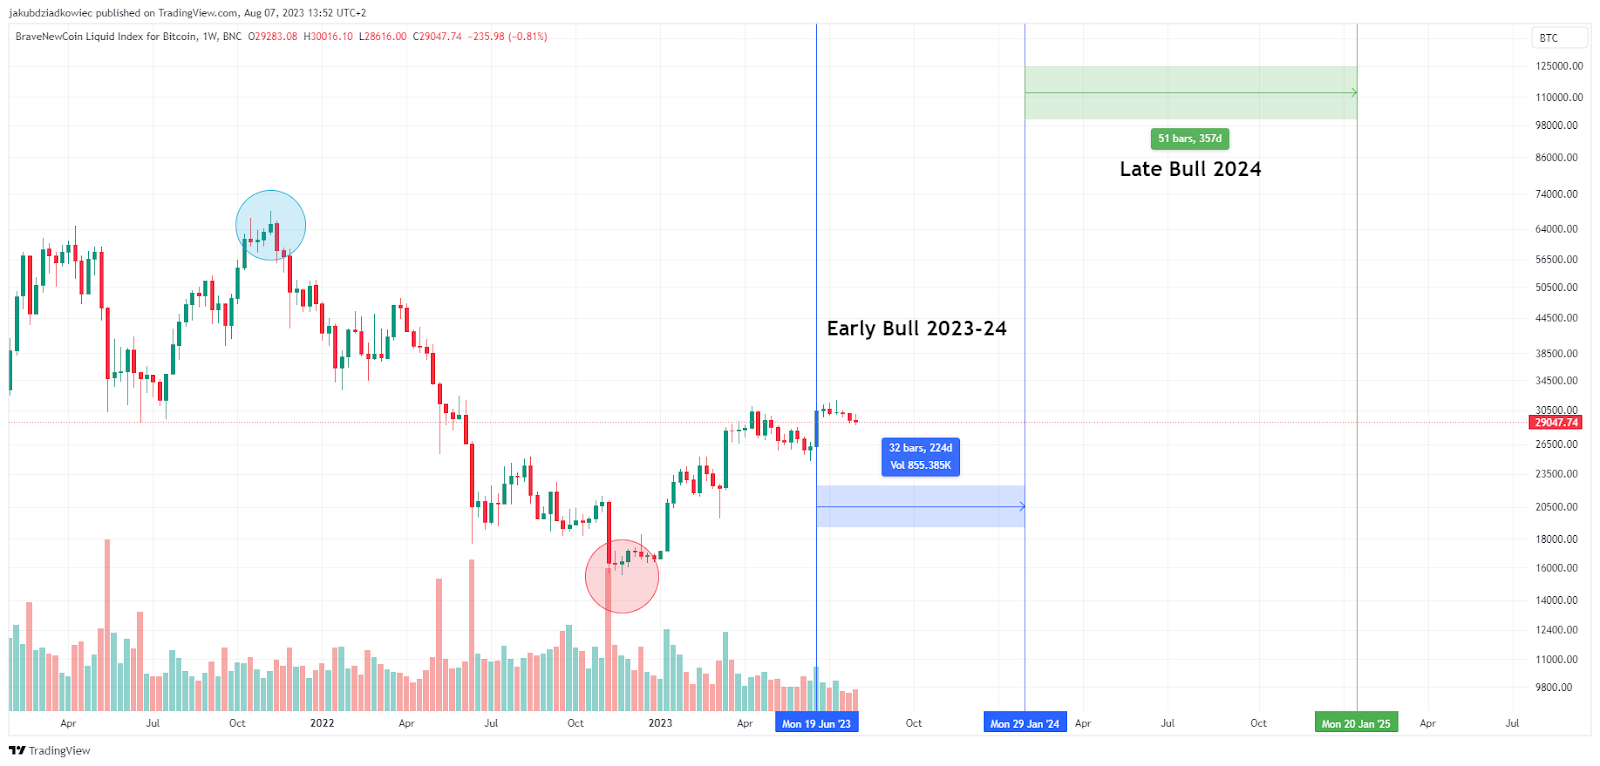
One can now try to extrapolate the obtained results to the current market situation. We assume that Bitcoin accumulation in the early bull market began in mid-June 2023.
Then the NUPL indicator bounced from the orange area of hope and entered the yellow area of optimism. It is worth recalling that if NUPL falls into the orange range again, our calculations will have to be done all over again.
However, if this does not happen, it can be assumed that Bitcoin accumulation has been going on for about 7 weeks. Subtracting this value from the averaged accumulation time (32 weeks), we get a period of about 6 months. So the early bull market should last until the end of January 2024.
Then we need to add the average duration of the late bull market to this date, which is about 12 months. This gives us the second half of January 2025 as the peak of this cycle (green line).
Criticism and Optimism
It should be noted that the above calculations deviate from the canonical interpretation of Bitcoin 4-year cycle, which is based on a halving event. The main difference is that a late bull market usually begins only after halving. Currently, it is projected to occur in April 2024.
In addition, the period of time that would elapse between the market’s November 2022 macro bottom and the start of the late bull market would be considerably shorter than the previous two cycles.
In the standard interpretation, the accumulation after the market bottom and the early stage of the bull market last about 2 years. By contrast, according to NUPL-based calculations, it would be only 14 months.
Despite these differences and doubts around some of the assumptions made above, the NUPL indicator gives us interesting insights into the cryptocurrency market.
Even if the exact calculation is only estimate, the ongoing Bitcoin accumulation makes investors increasingly optimistic.
For BeInCrypto’s latest crypto market analysis, click here.
Disclaimer
Read More: 9 Best AI Crypto Trading Bots to Maximize Your Profits
[ad_2]
Source link